

Introduction
MedTech companies face a difficult balancing act: competing for scarce, specialized talent while staying within tight margin constraints. That talent includes R&D scientists with tissue-engineering expertise, regulatory affairs professionals holding RAC credentials, and clinical sales reps who speak the language of the cath lab.
Overpay, and profitability suffers. Underpay, and top performers walk to a competitor.
Compensation benchmarking is the systematic process that solves this. By comparing internal pay to external market data for comparable roles, companies can set salaries that attract and retain talent without guessing or overspending.
In MedTech, Gallup estimates replacement costs at about 80% of salary for technical professionals. Getting compensation wrong costs real dollars and institutional knowledge.
This guide explains how compensation benchmarking works, what data sources to use, and how to overcome the unique challenges MedTech roles present.
Key Takeaways
- Compensation benchmarking compares internal pay to external market rates using job duties, not titles alone
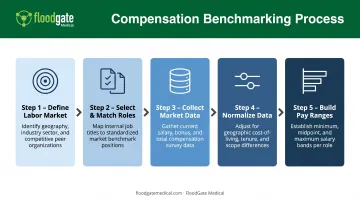
- The process requires defining your labor market, matching responsibilities, normalizing data, and building calibrated pay ranges
- MedTech benchmarking is complicated by specialized roles like regulatory affairs and clinical specialists that lack clean market comparables
- Certified roles such as RAC holders earn a measurable premium—RAPS reports a 9% average US pay increase
What Is Compensation Benchmarking?
Compensation benchmarking is the data-driven process of comparing pay for specific roles against external market rates within a defined labor market. WorldatWork defines it as comparing salaries and overall pay structure with similar employers in the same industry, geography, and workforce model for comparable roles.
Core inputs include:
- Industry-specific salary surveys (employer-submitted)
- Government labor statistics (such as the Bureau of Labor Statistics Occupational Employment and Wage Statistics)
- Compensation databases (Payscale, Mercer, Aon Radford McLagan)
- Consulting-firm reports and custom analyses
Benchmarking covers total compensation (base salary, annual bonuses, commissions, long-term incentives, and equity), not just base pay. For MedTech sales roles, this distinction matters.
MedReps reported a $104,638 average base for device sales reps in 2023, but 70% received bonuses averaging $38,198 and 52% received commissions averaging $42,104.
Factors That Influence Compensation Benchmarks
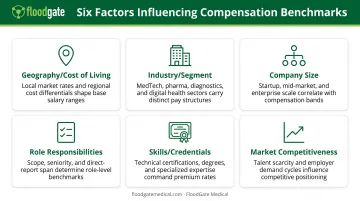
Six variables shape benchmark accuracy:
Geography and cost of living
A regulatory affairs specialist in Boston commands different pay than one in Minneapolis, even within the same company. Regional clusters (Boston for medical devices, Minneapolis for cardiac and neuro, the Bay Area for digital health) create distinct pricing dynamics.
Industry and segment
Medical-device manufacturers pay differently than pharma or contract research organizations. Even within devices, cardiovascular, orthopedics, and diagnostics have different labor markets.
Company size
AdvaMed found 94% of nearly 15,000 US medtech establishments had fewer than 100 employees. Startups and mid-market firms often can't match large-cap pay but compensate with equity or faster advancement.
Role responsibilities and scope
A "Clinical Specialist" supporting cath lab procedures is not interchangeable with a clinical specialist training orthopedic surgeons. Benchmark the job description, not the title.
Required skills and credentials
In MedTech, regulatory expertise and clinical or technical certifications command premium pay. RAPS found RAC holders averaged 9% more than non-certified regulatory professionals in its US respondent group.
Market competitiveness and scarcity
While AdvaMed reports strong industry job growth, MedTech Dive counted more than 14,000 layoffs from January 2023 to mid-2024. Scarcity varies by role and geography. Benchmark at that level, not across the entire industry.
Why Compensation Benchmarking Matters
Turnover is expensive. Gallup estimates replacement costs at about 200% of salary for leaders and managers, 80% for technical professionals, and 40% for frontline employees. For a regulatory affairs manager earning $120,000, that's roughly $96,000 in recruiting, onboarding, lost productivity, and institutional knowledge.
Gallup also found that 42% of recent voluntary leavers believed their manager or organization could have prevented the exit. Fair, benchmarked pay directly affects:
- Employee retention – Competitive pay reduces the financial incentive to leave
- Recruitment speed – Market-aligned offers close faster and generate fewer declines
- Morale and engagement – Employees who feel fairly compensated perform better and refer peers
- Employer brand – A reputation for fair pay attracts passive candidates and strengthens referrals
In MedTech, where specialized roles are hard to fill and knowledge transfer takes months, benchmarking protects both profitability and continuity.
How to Benchmark Compensation: A 5-Step Process
Step 1: Define Your Competitive Labor Market and Pay Strategy
Identify where you compete for talent:
- Geography – Local metro, regional corridor (e.g., Boston-Cambridge cluster), or national/remote
- Industry – Medical devices only, or broader healthcare technology and life sciences
- Company size – Revenue, employee count, or funding stage
Then set your pay positioning strategy:
- Lead the market (75th percentile or higher) – Accelerates hiring for critical or scarce roles
- Match the market (50th percentile) – Balances cost and competitiveness
- Lag the market (25th percentile) – Lowers cash spend; requires strong equity, mission, or benefits to offset
Step 2: Select Benchmark Roles and Match by Responsibilities
Choose roles that are:
- Business-critical (revenue-generating, compliance-required)
- High-turnover or hard-to-recruit
- Frequent enough to justify the analysis effort
Match jobs by duties and scope, not titles. A "Regulatory Specialist" at one company may handle 510(k) submissions and post-market surveillance; at another, only device registration and labeling. Compare:
- Core responsibilities and deliverables
- Supervisory scope (individual contributor vs. manager)
- Required experience and credentials
- Decision-making authority
Step 3: Collect Market Data from Multiple Sources
Use at least two independent sources to triangulate:
- Government data – BLS provides free, statistically valid baselines. For example, BLS reported $93,480 mean annual pay for compliance officers in medical-equipment manufacturing (May 2023).
- Industry surveys – Employer-submitted surveys (Mercer, Radford, RAPS) offer peer cuts and suppress results to protect confidentiality.
- Role-specialist sources – MedReps for device sales, RAPS for regulatory, Gateway Recruiting for field-clinical specialists.
- Compensation databases – Payscale and Aon combine employee-reported and employer-submitted data.
Avoid relying on a single survey, especially if sample sizes are small or methodology is unclear.
Step 4: Normalize the Data
Raw survey data reflects different dates, geographies, and company types. Normalize by:
- Aging to a common date – Apply inflation or wage-growth adjustments if data is 12+ months old
- Geographic differentials – Adjust for cost-of-living or local labor-market premiums
- Company-size adjustments – Scale up or down if your peer group differs materially from the survey sample
Step 5: Build Pay Ranges and Calibrate Against Internal Equity
Construct ranges with:
- Minimum – Entry-level or newly qualified incumbents (typically 80-90% of midpoint)
- Midpoint – Fully competent performer at your target percentile (e.g., market 50th)
- Maximum – Top performer or long-tenured specialist (typically 110-120% of midpoint)
Before finalizing, check internal equity:
- Are employees in similar roles paid consistently?
- Do pay differences reflect experience, performance, or tenure—not bias or favoritism?
- Will the new structure create compression (junior employees earning close to senior peers)?
Adjust ranges or individual placements to close unintended gaps before you roll the structure out.
Where to Find Compensation Data and Tools
| Source | Best Use | Limitations |
|---|---|---|
| BLS OEWS | Defensible occupation, industry, and metro baselines; free and transparent | Broad job titles can miss specialization; excludes variable pay |
| Mercer | Strong peer cuts when job matches are clear; covers 31,000+ US jobs and 20M+ employees | Subscription required; each statistic needs at least five companies |
| PayScale | Real-time market data; combines employee and employer datasets | Methodology varies by product; identify which dataset you're using |
| Aon Radford McLagan | Participant-only database with 8,500+ organizations and 30M+ employees | Participant access only; medical devices not listed as a separate category |
| MedReps | Captures base, bonus, and commission for device sales roles | Public articles omit sample size and methodology |
| RAPS | Biennial regulatory-profession survey with certification cuts | Covers healthcare products broadly, not just devices |
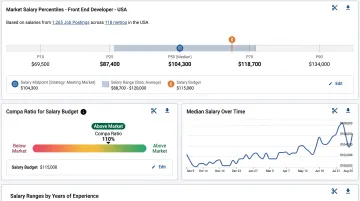
Reliability tradeoff:
Not every source is equally defensible. Weigh cost, currency, and rigor:
- Crowdsourced or employee-reported data (such as Glassdoor and Salary.com) is free and current, but self-reported figures lack validation and samples skew toward job seekers
- Employer-submitted surveys cost more, yet they offer identifiable peer groups, suppression rules, and transparent methodology
- Government data (BLS) is free and statistically valid, but often lags 12–18 months and uses broad occupational categories
Best practice: Triangulate. Use BLS for a defensible baseline, add an industry-specific source (MedReps, RAPS), and layer in a paid peer survey (Mercer, Radford) for roles where precision matters.
Software and platforms:
Dedicated compensation software (Salary.com CompAnalyst, PayScale MarketPay) and people-analytics platforms can automate benchmarking and push updates into your HRIS. For niche industries like MedTech, specialized recruiting partners—such as FloodGate Medical—often pair compensation insights with talent advisory, which helps when roles lack clean market comparables.
Compensation Benchmarking Challenges in MedTech Hiring
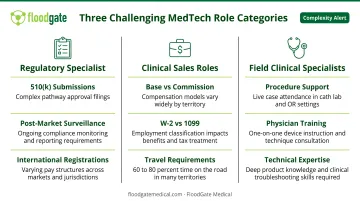
MedTech roles often lack clean market comparables. A "Regulatory Specialist" might handle 510(k) submissions, post-market surveillance, or international registrations—each requiring different expertise and commanding different pay. Generic salary surveys that lump all regulatory roles together produce unreliable benchmarks.
Regional hubs complicate the picture.
AdvaMed reported 20,400 direct medtech workers in Massachusetts and Medical Alley reported 26,500 in Minnesota, but neither published state-specific average pay by role. National averages miss the premium that Boston, Minneapolis, and Bay Area hubs command for specialized talent.
Clinical and technical sales present another gap.
Device sales reps carrying a quota, field-clinical specialists supporting procedures, and cath-lab specialists training physicians often share overlapping titles. Their pay structures differ sharply: base vs. commission-heavy, W-2 vs. 1099, travel load, and procedure-volume exposure.
Where specialized recruitment partners add value
Industry-focused firms close the gaps generic surveys leave open. FloodGate Medical, for example, draws on more than 25 years of MedTech talent advisory and 450+ placements a year to inform compensation benchmarking, workforce planning, and real-time market intelligence.
That lens matters most for regulatory, clinical, and technical sales roles, where title noise and variable pay make all-industry data unreliable—and where DEI-minded hiring still needs accurate ranges, not guesswork.
Benchmark MedTech roles with a mix of sources:
- Government data for baseline validity
- Role-specialist sources for variable pay and certification premiums
- Industry-focused recruitment or advisory partners for hard-to-fill specialized roles
Skip generic, all-industry surveys when the job needs clinical knowledge, regulatory certification, or procedure-room experience.
Frequently Asked Questions
What is compensation benchmarking?
Compensation benchmarking is the process of comparing internal pay to external market data for similar roles to ensure competitive, fair compensation. It uses salary surveys, government data, and peer comparisons to set pay that attracts and retains talent without overspending.
How do you benchmark compensation?
Start by defining your labor market and pay philosophy, then match roles by duties—not job titles. Pull data from several reputable sources, adjust for location and timing, and set ranges that also hold up against internal equity.
What are the 5 steps of benchmarking?
The five steps are: (1) define your competitive labor market and pay positioning strategy, (2) select and match benchmark roles by duties and scope, (3) collect market data from multiple sources, (4) normalize data by date and geography, and (5) build pay ranges and calibrate against internal equity.
What sources do most employers use to benchmark compensation?
Most employers combine industry-specific salary surveys (employer-submitted), government labor statistics (BLS OEWS), compensation databases (PayScale, Mercer, Radford), and consulting-firm reports. The best approach triangulates at least two independent sources to validate accuracy.
What is the best compensation benchmarking tool?
It depends on company size, industry, and role mix. Survey platforms (Mercer, Radford) suit common roles; tools like Salary.com or PayScale MarketPay automate updates. For niche MedTech roles with thin market data, partners like FloodGate Medical add industry-specific benchmarks and advisory.