Introduction
Most drugs that enter clinical trials never make it to a pharmacy shelf. That single fact shapes every investment decision, hiring plan, and pipeline strategy in biopharma.
To put real numbers behind that risk, BIO partnered with Biomedtracker and Amplion in 2016 to answer a deceptively simple question: what are the real odds? The resulting report, Clinical Development Success Rates 2006-2015, analyzed 9,985 phase transitions across 7,455 development programs and 1,103 companies — the largest study of its kind at the time.
This article breaks down phase-by-phase odds, where therapeutic areas diverge, why biomarkers change the math, and what it means for building teams that can survive the attrition curve.
Key Takeaways
- Phase I overall likelihood of approval (LOA) was just 9.6%, rising to 11.9% excluding oncology
- Phase II remains the toughest hurdle, advancing only 30.7% of candidates to Phase III
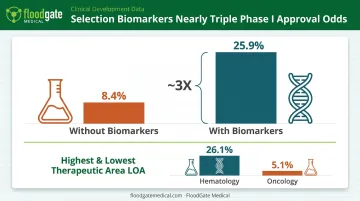
- Hematology posted the highest Phase I LOA (26.1%); oncology posted the lowest (5.1%)
- Selection biomarkers roughly tripled Phase I LOA — 8.4% without them versus 25.9% with them
- Given these odds, companies that pair rigorous science with experienced regulatory and clinical talent at each transition point are better positioned to keep candidates advancing
Understanding the 2006–2015 Clinical Development Success Rates Study
BIO announced the report on May 25, 2016, crediting a research team led by David Thomas alongside partners at Informa's Biomedtracker and Amplion. It covers a full decade of clinical and regulatory phase transitions, described by BIO as the largest such study ever conducted.
The scale is what set it apart:
- 9,985 phase transitions tracked
- 7,455 individual development programs
- 1,103 companies represented
- 14 disease areas analyzed separately
How the Numbers Were Calculated
The methodology relies on two distinct metrics, and mixing them up is a common mistake when people cite this study.
- Transition success rate: the percentage of programs that moved to the next phase, calculated against programs that either advanced or were suspended
- Cumulative likelihood of approval (LOA): the compounded probability of reaching market from any given starting phase, derived by multiplying the relevant transition rates together
Neither figure is interchangeable with the other. A phase's transition rate tells you your odds of clearing that specific hurdle. Cumulative LOA tells you your odds of eventually reaching approval, given where you're starting from.
How This Fits Prior Research
This wasn't the first attempt to quantify attrition. DiMasi's 2001 and 2010 work, Kola and Landis (2004), and Hay et al. (2014) all tackled similar questions using different cohorts and methods. The consistent thread across all of them: Phase II shows up repeatedly as the point of highest attrition.
Hay et al., for instance, found a 32.4% Phase II success rate for 2003-2011 data, directionally in line with Thomas et al.'s 30.7%. The exact numbers shift depending on dataset and calculation method, but the pattern of a mid-stage bottleneck has held for two decades.
Phase-by-Phase Breakdown: Where Drugs Succeed and Fail
Averages hide a lot. Here's what happens at each stage, based on BIO, Biomedtracker, and Amplion's analysis of more than 9,700 clinical development programs from 2006 to 2015.
Phase I: The Safety Gate
Phase I trials test safety and tolerability, not efficacy. Roughly 63.2% of candidates advance to Phase II. But overall LOA from Phase I to approval sits below 10%.
Most Phase I failures come down to:
- Poor tolerability
- Pharmacokinetic issues (how the drug moves through the body)
- Efficacy concerns, though these are rare this early in development
Phase II: The Valley of Death
This is where the real filtering happens. The focus shifts to proving a drug actually works, in larger and more expensive trials. Only 30.7% of candidates make it through, the lowest transition rate of any phase.
Most terminations here trace back to:
- Insufficient efficacy signals
- Emerging safety concerns not visible in smaller Phase I cohorts
- Strategic deprioritization by sponsors reallocating budget
Phase III: The Final Test
Success rates rebound to 58.1%, largely because Phase II already filtered out weaker candidates. Still, that means 41.9% of Phase III programs fail to reach an FDA filing, and lack of efficacy remains the dominant cause even at this late stage. That's a sobering number for programs that have already consumed years and often hundreds of millions of dollars.
Regulatory Filing and Approval
Once a marketing application is filed, odds jump sharply to 85.3%. However, only about 61% of original NDA/BLA filings succeed on the first review cycle. Accelerated-approval pathways (common in oncology) bring faster timelines but carry added post-approval risk, since the FDA can withdraw approval if confirmatory trials don't pan out.
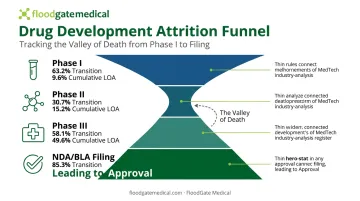
Here's the full picture in one view:
| Phase | Transition Rate | Cumulative LOA to Approval |
|---|---|---|
| Phase I | 63.2% | 9.6% |
| Phase II | 30.7% | 15.2% |
| Phase III | 58.1% | 49.6% |
| NDA/BLA Filing | 85.3% | 85.3% |
Success Rates by Therapeutic Area and the Biomarker Effect
Averages mask enormous variance across the 14 disease areas the study tracked.
Hematology posted the highest Phase I LOA at 26.1%, driven largely by strong results in hemophilia and blood-protein deficiency programs. Some individual hemophilia indications topped 50% LOA, while venous thromboembolism and neutropenia programs performed closer to average.
Oncology sat at the opposite end, with the lowest Phase I LOA of any area studied at 5.1%. Oncology also had the fastest filing-to-approval timeline, roughly 1.1 years, thanks largely to expedited pathways like Breakthrough Therapy designation.
Rare Disease vs. Chronic, High-Prevalence Conditions
Rare disease programs consistently outperformed the broader dataset at every phase. Non-oncology rare-disease Phase I LOA reached 25.3%, nearly triple the rate for chronic, high-prevalence diseases at 8.7%.
Why the gap? Rare disease trials typically involve:
- Smaller, more homogenous patient populations
- Clearer genetic or biomarker-defined diagnostic criteria
- Less variability in disease progression
Chronic diseases like diabetes or hypertension involve messier, more heterogeneous populations and harder-to-design trials, which drags success rates down.
The Biomarker Advantage
The study's most actionable finding: programs using selection biomarkers (tools that identify patients most likely to respond) achieved a 25.9% Phase I LOA, compared to just 8.4% for programs without them. That's roughly a threefold difference.
This isn't proof that biomarkers alone cause better outcomes. But the association is strong enough that targeting well-defined, biomarker-selected populations has become a standard strategic playbook, one that increasingly shapes how biotech and MedTech companies structure their clinical operations and R&D teams from the earliest planning stages.
Beyond 2015: How Success Rates Have Evolved
The 2006-2015 window isn't the last word. A 2021 follow-up study covering 2011-2020 found overall LOA had actually dropped, to 7.9%, largely because Phase I transition rates fell from 63.2% to 52.0%. Oncology barely moved, edging from 5.1% to 5.3% LOA, though immuno-oncology programs performed notably better at 12.4%.
Other research tells a more optimistic story:
| Study | Overall LOA | Key Finding |
|---|---|---|
| BIO/Informa/QLS (2011-2020) | 7.9% | Phase I transition rates declined sharply |
| Wong, Siah & Lo (2019) | 13.8% | Different methodology; lower oncology estimate |
| Pammolli et al. (2020) | — | Attrition rates decreasing across most stages, except Phase II |
The takeaway for anyone evaluating a current pipeline: don't treat this decade-old baseline as gospel. Compare it against more recent datasets before drawing conclusions about a specific program or therapeutic area.
What This Means for MedTech & Biotech Talent Strategy
A 30.7% Phase II transition rate signals a real workforce planning challenge. Companies navigating this level of attrition need clinical, regulatory, and R&D teams built for resilience, not just headcount.
Talent matters most at two specific points.
Phase II is where experienced biostatisticians and clinical operations leaders can mean the difference between a trial that generates a clean efficacy signal and one that doesn't.
Phase III is where regulatory strategists who've navigated FDA filings before help avoid the kind of preventable missteps that push a program into the 41.9% that never reach filing.
This is the environment FloodGate Medical works in every day. As a recruiting firm focused exclusively on MedTech, the company's Talent Directors partner directly with leadership across Clinical Affairs, R&D, and Regulatory functions. Their goal: align hiring strategy with a company's actual product milestones, not just open headcount.
FloodGate's approach centers on equity, diversity, and inclusion in how candidate pools get built, on the premise that diverse teams make better decisions under the kind of uncertainty this data describes. For companies staring down a Phase II trial with a 1-in-3 shot of advancing, the people running it are as much a variable as the science itself.

Frequently Asked Questions
What is the overall probability that a drug entering Phase I will eventually reach the market?
According to Thomas et al. (2016), the overall likelihood of approval from Phase I was 9.6% across all indications, rising to 11.9% when oncology is excluded from the dataset.
Why is Phase II considered the hardest phase to pass in drug development?
Phase II is where programs must first prove real efficacy in larger trials, not just safety. Only about 30.7% of candidates advance, making it the lowest-success transition of any development stage, often called the "valley of death."
Which therapeutic areas have the highest and lowest clinical trial success rates?
Hematology had the highest Phase I LOA at 26.1%, largely driven by hemophilia programs. Oncology had the lowest at 5.1%. Rare disease programs generally outperformed both due to well-defined patient populations.
How much do biomarkers improve the odds of clinical trial success?
Programs using selection biomarkers achieved a 25.9% Phase I LOA, compared to 8.4% for programs without them, roughly a threefold difference, based on Amplion's BiomarkerBase analysis.
What are the most common reasons clinical trials fail?
Phase I failures typically stem from tolerability or pharmacokinetic issues. Phase II and III failures are dominated by lack of efficacy, with safety signals and strategic deprioritization also playing a role.
Has drug development success improved since the 2006–2015 study period?
Results are mixed. The 2011–2020 update showed overall LOA falling to 7.9%, while Pammolli et al. (2020) found attrition decreasing at several stages. The data points to modest, uneven progress rather than a clear trend.